
Summary: The Bradley Curve shows that safety culture maturity and operational performance rise together as organizations move from reactive behavior to interdependent accountability. It gives EHS leaders a practical framework for diagnosing culture, setting improvement priorities, and linking safety investments to lower incident rates and stronger business results. In practice, the Bradley Curve matters because it turns safety culture from an abstract goal into a staged roadmap for continuous improvement.
Table of contents
The Bradley Curve is a safety culture framework that maps the relationship between an organization’s safety culture maturity and its operational performance — showing how advancing through four stages of safety culture directly drives reductions in incident rates, TRIR, and the costs of poor safety performance. For EHS managers, safety directors, and operations leaders, the Bradley Curve provides both a diagnostic tool for assessing current safety culture and a strategic roadmap for continuous improvement aligned with ISO 45001:2018 and OSHA best practices.
Operational excellence — the ability to reliably and consistently deliver value for stakeholders, employees, and customers — is not achieved by focusing on financial metrics alone. Organizations that lead in operational performance typically demonstrate a distinguishing characteristic: a mature, proactive safety culture that is deeply embedded in daily work behaviors and management practices.
The Bradley Curve makes this connection explicit. By illustrating how safety culture maturity directly correlates with outcomes in quality, efficiency, and profitability, it provides EHS and operations leaders with a compelling, evidence-based case for safety culture investment — one that resonates with finance, operations, and executive leadership alike.
What is the Bradley Curve?
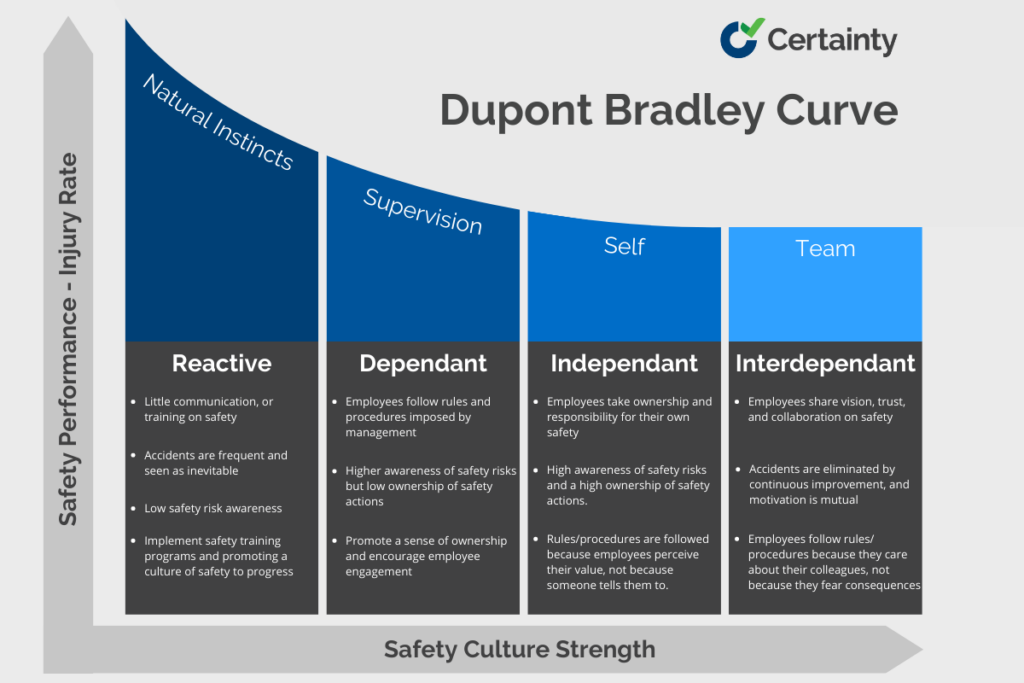
The Bradley Curve is a framework that illustrates the relationship between safety culture and operational performance. It shows how improving safety culture leads to better outcomes in other aspects of performance — including quality, efficiency, productivity, and profitability — by reducing the systemic costs and disruptions that poor safety performance creates.
The original Bradley Curve was developed by DuPont in 1995, inspired by a plant manager’s interpretation of principles from Stephen Covey’s work on personal and organizational effectiveness. The framework has since been adopted by organizations across high-hazard industries worldwide — including oil and gas, mining, construction, manufacturing, and utilities — as a practical tool for assessing safety culture maturity and directing improvement efforts. It underpins the safety culture development journey described in ISO 45001:2018’s worker participation and continual improvement requirements.
The original three-stage model has since been updated to include a fourth and critical stage — the Interdependent Stage — which reflects the highest level of safety culture maturity: a state where safety is collectively owned and driven by the workforce, not just enforced by management.
What makes the Bradley Curve particularly valuable for safety leaders is that it is not prescriptive or linear, but descriptive and dynamic. Organizations do not automatically progress through the stages with time; advancement requires deliberate leadership, measurement, and intervention. The Curve helps organizations honestly assess their current position, identify specific behavioral and systemic gaps, and track the impact of improvement initiatives on both safety culture indicators and leading/lagging safety KPIs.

30+ Audit and inspection checklists free for download.
The 4 Stages of the Bradley Curve
The Bradley Curve’s four stages describe a progression in safety culture maturity — from purely reactive responses to accidents, through rule-driven compliance, individual ownership, and ultimately to collective, interdependent safety responsibility. Each stage has distinct characteristics in employee attitudes, management behaviors, leading indicators, and safety outcomes. Understanding which stage your organization currently occupies is the essential first step toward targeted, sustainable improvement.
Reactive Stage
The Reactive Stage represents the lowest level of safety culture maturity, where employees rely on instinct, look out only for themselves, and treat accidents as an unavoidable feature of the job. Management commitment to safety is minimal or absent; safety training is inadequate; and communication about hazards is inconsistent or ineffective. Organizations in the Reactive Stage typically experience high incident rates, frequent OSHA recordable injuries, and significant hidden costs from absenteeism, turnover, production disruptions, and regulatory non-compliance.
Behavioral indicators of the Reactive Stage include widespread tolerance of unsafe behaviors and conditions; a complete absence of worker ownership for safety outcomes; and a pervasive tendency to blame incidents on the actions of individual workers or on bad luck rather than on systemic failures or management deficiencies. If your organization consistently reacts to injuries rather than preventing them, and incident investigations focus on worker blame rather than root cause correction, you are likely operating in the Reactive Stage — and immediate, structured intervention is warranted.
Dependent Stage
The Dependent Stage is the second level of the Bradley Curve, where workers comply with safety directives and rules set by management, but primarily because they are required to — not because they personally value safety or understand its purpose. Safety awareness and formal training have improved, but motivation is externally driven: workers follow the rules to avoid reprimand, not to protect themselves or their colleagues.
While injury rates are typically lower in the Dependent Stage than in the Reactive Stage — because compliance with basic safety rules does prevent many incidents — the safety system remains fragile. Worker ownership of safety is limited: employees do not seek out hazards proactively, do not suggest improvements voluntarily, and tend to view safety as management’s responsibility rather than a shared professional standard. Accidents are still viewed as isolated events or unavoidable occurrences rather than as symptoms of systemic gaps. Organizations in this stage often achieve adequate OSHA compliance on paper while remaining vulnerable to serious incidents when supervisory pressure relaxes or when workers encounter situations not explicitly covered by existing rules.
Independent Stage
At the Independent Stage — the third level of the Bradley Curve — individual workers take genuine ownership and accountability for their own safety. Workers at this stage have a strong personal understanding of the risks associated with their work and a genuine motivation to manage those risks, not because management requires it, but because they recognize the value of going home safely every day.
In the Independent Stage, employees consistently follow safety rules and procedures because they understand why those procedures exist — not merely because they are mandated. They identify and report hazards proactively, participate constructively in safety observations and near-miss reporting, and take personal pride in their safety performance. Incident rates at this stage are significantly lower than in earlier stages, and safety metrics — including TRIR, inspection completion rates, and corrective action closure rates — reflect a workforce that is engaged with safety as a core professional value.
Interdependent Stage
The Interdependent Stage is the highest level of safety culture maturity on the Bradley Curve, characterized by collective safety ownership — employees actively look out for each other and treat team safety as a shared, non-negotiable responsibility. This stage reflects the ideal articulated in ISO 45001:2018’s worker participation and consultation requirements: a workforce where safety improvement is driven from the bottom up as well as the top down.
At the Interdependent Stage, workers are highly attuned to safety risks in their own work and in the work of those around them. They intervene respectfully when they observe unsafe behaviors — not to report colleagues, but because they genuinely care about their wellbeing. Near misses are reported openly and discussed as team learning opportunities, not covered up out of fear. Safety suggestions are offered regularly and acted upon visibly by management. Organizations at this stage achieve the lowest incident rates and the highest levels of regulatory audit readiness — and they sustain these outcomes even in the absence of direct supervisory oversight, because safety is embedded in the culture itself.
How to Implement the Bradley Curve
Applying the Bradley Curve framework to your organization requires a structured, data-driven approach. The following four-step process provides a practical pathway for EHS managers and safety directors to assess current safety culture maturity, identify targeted improvement opportunities, and build an evidence-based action plan aligned with ISO 45001 continual improvement principles:
1. Assess Your Current Performance
Accurately locating your organization on the Bradley Curve requires collecting and analyzing both quantitative safety performance data and qualitative safety culture indicators. Quantitative KPIs — including Total Recordable Incident Rate (TRIR), Lost Time Injury Frequency Rate (LTIFR), near-miss reporting rates, inspection completion rates, and corrective action closure times — provide objective evidence of safety outcomes. Qualitative inputs — including workforce surveys, direct observation programs, safety culture interviews, and internal audit findings — reveal the underlying behavioral and attitudinal drivers that the numbers alone cannot capture. For more on how inspection software supports Bradley Curve progression, see our practitioner’s guide.
While many safety KPIs can serve as diagnostic indicators, near-miss reporting rate, injury rate, and incident rate are three foundational metrics we recommend as a minimum starting point for any Bradley Curve assessment. Organizations that are genuinely at the Independent or Interdependent stage consistently demonstrate near-miss reporting rates that are substantially higher than their lagging injury rates — a reliable indicator of proactive hazard identification and open safety culture.
2. Identify Improvement Opportunities
With your current stage assessed, the next step is to identify the specific gaps between where your organization is and where it needs to be — both in safety culture behaviors and in supporting systems and processes. Root cause analysis of recent incidents and near misses can reveal systemic weaknesses in leadership commitment, hazard reporting culture, training effectiveness, or corrective action follow-through. SWOT analysis, external safety culture benchmarking, and gap analysis against ISO 45001 requirements provide additional structured frameworks for identifying high-priority improvement opportunities.
3. Develop Action Plans
Translate identified improvement opportunities into specific, time-bound action plans with clear ownership and measurable success criteria. SMART goal frameworks, Plan-Do-Check-Act (PDCA) cycles, and RACI matrices provide effective structures for defining objectives, assigning responsibilities, sequencing actions, and establishing review milestones. Action plans should address both behavioral interventions — leadership safety walks, worker participation programs, near-miss reporting campaigns — and systemic improvements such as inspection platform upgrades, training curriculum enhancements, and corrective action tracking system implementations.
4. Implement and Monitor
Execute your action plans systematically and monitor their impact on both leading and lagging safety indicators. Track implementation progress and safety culture movement using a combination of tools:
- Dashboards: Real-time visual displays of safety KPIs — including TRIR, inspection completion rates, corrective action closure rates, and near-miss reporting volume — that provide immediate, site-specific performance visibility for safety managers and executive leadership.
- Reports: Structured analysis documents that summarize safety performance data, trend analysis, and actionable improvement recommendations — essential inputs for ISO 45001 management reviews and OSHA regulatory reporting.
- Feedback loops: Systematic processes for collecting, acting on, and communicating back to the workforce the outcomes of safety observations, audit findings, and improvement suggestions — a critical driver of the worker participation and psychological safety that the Interdependent Stage requires.
Self-Assessing Your Safety Culture
Conducting a meaningful self-assessment of your safety culture requires time, resources, and direct engagement with workers and leaders at all levels of the organization. Surveys, observation programs, audit data analysis, and structured interviews are all valuable inputs. However, the table below provides a practical starting framework — a quick diagnostic that gives safety managers and EHS directors an initial, high-level indication of where their organization may sit on the Bradley Curve. This table is not a definitive assessment tool, but a supplement to deeper investigation that can help frame the conversation and direct further inquiry.
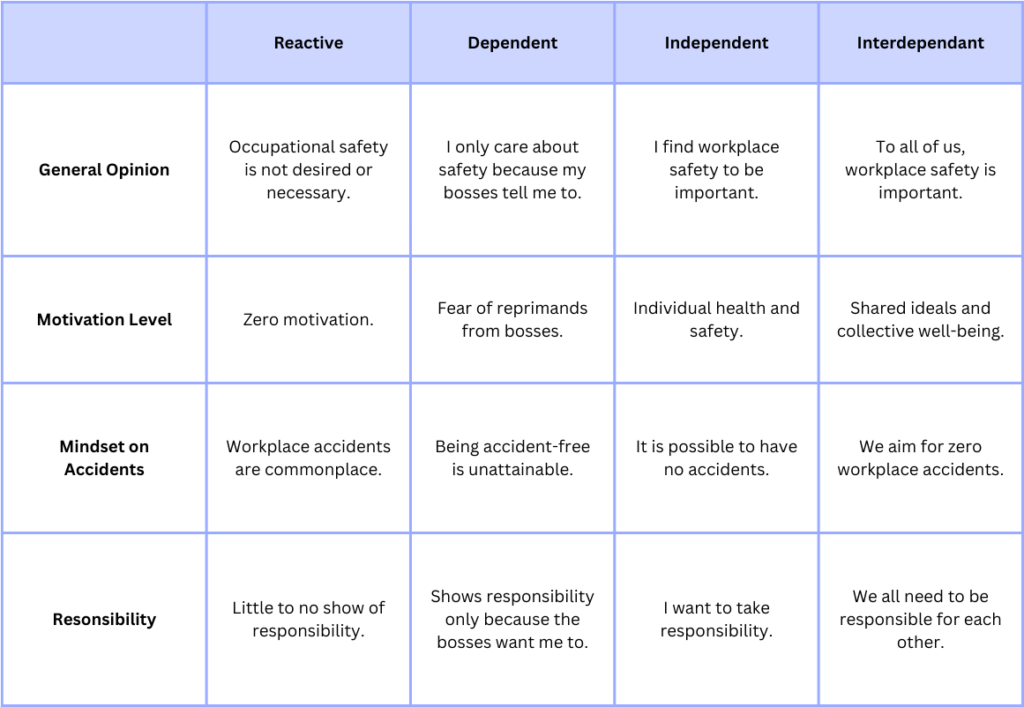
If you observe that your employees consistently follow safety procedures only when supervisors are present and visibly watching — going through the motions of compliance rather than genuinely embracing safe behaviors — you are most likely operating in the Dependent Stage. Conversely, if your workforce proactively identifies and reports hazards without prompting, discusses near misses openly as team learning opportunities, and holds each other accountable for safety as a matter of professional pride, your organization is likely approaching or has reached the Interdependent Stage. Use this self-assessment table as a starting point for a more structured, data-supported evaluation of your position on the Curve.
How to Optimize Your Safety Culture
The most common barrier to reliable Bradley Curve self-assessment and safety culture improvement is data quality. If your safety inspection data is incomplete, inaccurate, inconsistently collected, or locked in paper-based systems that prevent meaningful aggregation and trend analysis, your view of your organization’s true safety culture maturity will always be limited — and your improvement efforts will lack the evidence base they need to drive real change.
Advancing on the Bradley Curve requires more than leadership commitment and behavioral programs. It requires a robust, reliable system for capturing, analyzing, and reporting safety performance data — one that gives safety managers the real-time visibility to identify gaps, track trends, and demonstrate the impact of improvement initiatives to senior leadership and regulators. Without accurate, timely data, it is impossible to distinguish genuine cultural progress from superficial compliance.
Certainty Software is an enterprise-level inspection and audit management platform purpose-built for organizations committed to improving their safety culture and operational performance. With Certainty Software, you can:
- Easily create and customize forms for any type of safety inspection, audit, behavioral observation, or near-miss report — configured to your specific regulatory requirements and Bradley Curve improvement objectives
- Collect safety data wherever your teams work — online, offline, in the field, on the shop floor, or across multiple sites — with automatic synchronization to a central, secure platform
- Track and manage issues, risks, and non-conformances by creating, assigning, and monitoring corrective actions through to verified closure — directly supporting ISO 45001 continual improvement requirements
- Report consistent, comparable, and accurate safety performance metrics using real-time dashboards, automated reports, and executive-ready safety scorecards that give leadership the data they need to make informed decisions
- Benchmark and track your safety culture progress using the Bradley Curve framework — with trend data that makes cultural advancement visible and measurable over time
To learn more about Certainty and how it can support your safety culture improvement journey, schedule a brief demo with our team today.
Frequently Asked Questions (FAQs)
What is the Bradley Curve used for in safety management?
The Bradley Curve is used as a diagnostic and strategic tool in safety management to assess an organization’s current safety culture maturity, identify behavioral and systemic gaps, and guide targeted improvement initiatives. It is particularly valuable for EHS managers and safety directors who need to communicate the business case for safety culture investment to senior leadership — by demonstrating the direct link between safety culture advancement and improvements in incident rates, operational efficiency, and regulatory compliance performance.
How does the Bradley Curve relate to ISO 45001?
ISO 45001:2018 requires organizations to establish, implement, and continually improve an occupational health and safety management system — with worker participation, leadership commitment, hazard identification, and performance evaluation as core requirements. The Bradley Curve’s four stages map directly onto the progressive safety culture maturity that ISO 45001 drives organizations toward: from reactive compliance (Dependent Stage) through active worker participation and ownership (Independent Stage) to the shared safety responsibility and continuous improvement culture (Interdependent Stage) that represents ISO 45001 best practice implementation.
Can an organization move backwards on the Bradley Curve?
Yes — because the Bradley Curve is dynamic rather than linear, organizations can regress from a higher stage to a lower one. Common causes of regression include significant leadership changes that reduce visible safety commitment, rapid workforce growth that dilutes established safety culture norms, major organizational restructuring that disrupts safety accountability structures, or periods of intense production pressure that create implicit incentives to deprioritize safety. Regular safety culture assessment, consistent leadership modeling, and data-driven monitoring of leading safety indicators are the most reliable defenses against cultural regression.
You may also be interested in: