
Summary: Customer satisfaction metrics — Net Promoter Score (NPS), Customer Satisfaction Score (CSAT), and Customer Effort Score (CES) — provide Quality Managers with auditable, ISO 9001 Clause 9.1.2-compliant data on how well products and services meet customer expectations. Tracking these KPIs delivers insights that go beyond marketing into quality, safety, and supply chain improvements, helping organizations reduce non-conformance rates, lower cost of poor quality (COPQ), and improve first pass yield through customer-driven quality management.
In a recent article from Deloitte, they found that businesses that offer a high-quality customer experience can lower the cost of serving customers by up to 33%. With competition growing rampantly across the business landscape, customer loyalty has grown in importance. The Customer Satisfaction Assessment helps to address customer needs and strengthen the customer relationship, rather than just reducing the number of complaints. In addition, Customer Satisfaction Assessment metrics also deliver insights into opportunities for quality, safety, supply chain, and ESG improvements not noticed before.
For Quality Managers, Plant Managers, and Process Improvement Leads, customer satisfaction data is more than a marketing metric. Under ISO 9001 Clause 9.1.2, organizations are required to monitor customer perceptions of the degree to which their needs and expectations have been fulfilled. Tracking customer satisfaction metrics such as NPS, CSAT, and CES provides a structured, auditable method for meeting this requirement while driving measurable improvements in non-conformance rates, Cost of Poor Quality (COPQ), and First Pass Yield (FPY).
There are many ways to measure customer satisfaction, and the right metric depends on factors like customer involvement, interaction, needs, and experience. It’s important that you and your customer experience team plan for the following before beginning your assessment:
- Selecting the right types of questions (multi-choice, Likert scale, open-ended, etc.).
- Asking the right questions.
- Deciding the optimal survey tools (online survey, social media, in-store, etc.).
- Understanding of your customer base, customer journey, demographic, customer support channels, etc.

30+ Audit and inspection checklists free for download.
So, what customer satisfaction assessment metrics are useful for your market research on customer satisfaction? There are three commonly targeted customer feedback survey Key Performance Indicators (KPI):
Net Promoter Score (NPS)
NPS (Net Promoter Score) is a metric used in customer satisfaction surveys. It is a simple Likert Scale question that measures loyalty, satisfaction, and enthusiasm. The one question for an NPS Survey is as follows:
“How likely are you to recommend our business/product/service to others on a scale of 0-10?”
The rating scale responses will help you determine your business’s Promoters (score of 9 to 10), your Detractors (score of 0 to 6), and your Passive audience (score of 7 to 8).
After you’ve tallied your responses, you need to calculate your final NPS score. The formula is as follows:
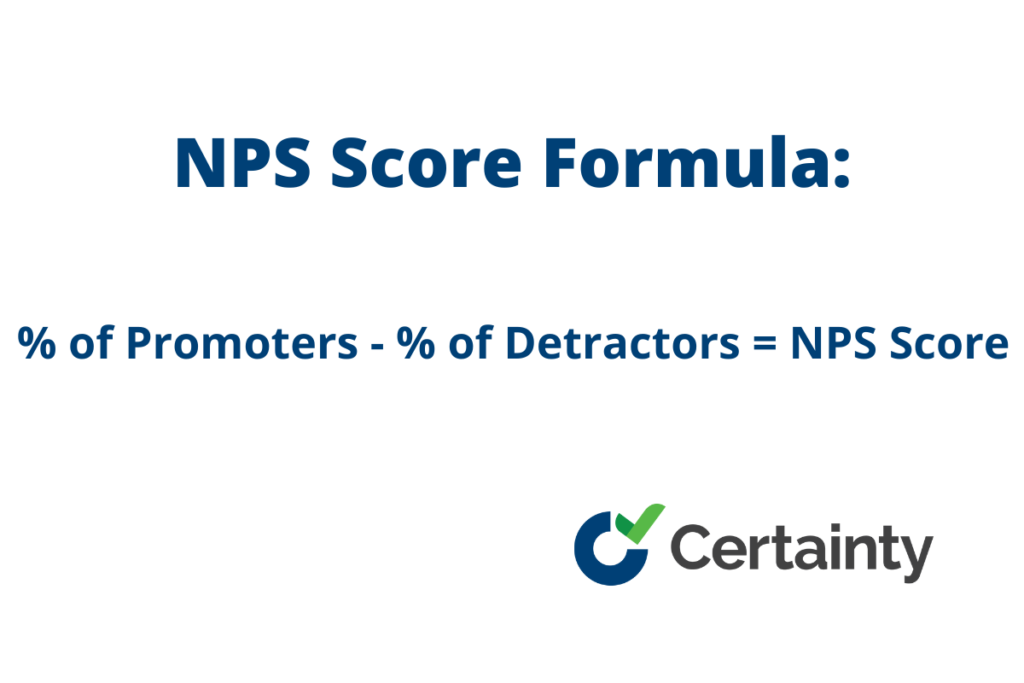
NPS scores can range from -100 to +100 and calculating this will provide customer insights and create opportunities to:
- Develop actions based on customer feedback
- Encourage your most loyal customers (Promoters) to advocate and promote the brand
From a quality management perspective, NPS is a leading indicator of how customers perceive your product and process quality. A declining NPS often signals emerging quality issues before they surface as formal complaints or non-conformance reports. Quality Engineers and VP Quality Assurance leaders can use NPS trend data to prioritize CAPA (Corrective and Preventive Action) initiatives, focusing resources on the root causes that drive detractor scores. In regulated environments governed by IATF 16949 or FDA cGMP, NPS provides an externally validated data point to complement internal audit findings.
Customer Satisfaction Score (CSAT)
Another useful metric to measure your customer’s level of satisfaction is using CSAT. Like NPS, your CSAT score can be identified through one simple Likert Scale question during your customer satisfaction survey:
“How would you rate our customer service?”
or
“Overall, how satisfied were you with our customer service?”
Response options are generally based on a 1-5 rating with 1 being extremely dissatisfied and 5 being extremely satisfied.
Here is the formula to calculate your CSAT Score:
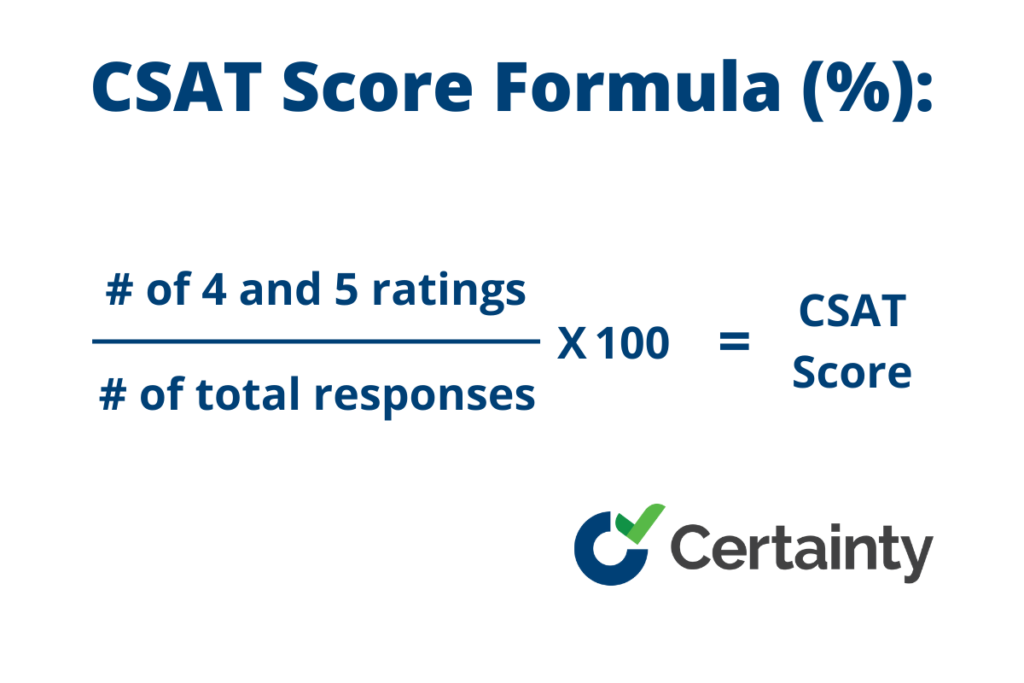
Generally, a respondent’s score of over 70% is considered successful. However, each business has its benchmarks for customer satisfaction based on its own goals.
If you receive a low score on a customer satisfaction survey, follow up with an open-ended question to find out how you can improve the customer experience.
CSAT is particularly valuable as a quality KPI because it can be segmented by product line, facility, or process area. QA Directors and Quality Supervisors can correlate CSAT results with internal quality metrics such as audit completion rates and non-conformance trends to identify which sites or processes require attention. For organizations working under HACCP or ISO 9001 frameworks, CSAT data supports management review inputs and helps demonstrate continual improvement during certification audits.
Customer Effort Score (CES)
The Customer Effort Score (CES) measures how much effort your customers have to put into interacting with your product or service.
There are numerous customer satisfaction survey questions that businesses can use in their questionnaire to determine their CES score.
An example of a CES Score question is:
“To what extent do you agree with the following statement: The company made it easy for me to handle my issue?”
Generally, customers will rate their effort based on a 1 to 7 rating where:
7 = Strongly agree
6 = Agree
5 = Somewhat Agree
4 = Undecided
3 = Somewhat Disagree
2 = Disagree
1 = Strongly Disagree
After collecting the responses, you can use this formula to calculate your CES Score:
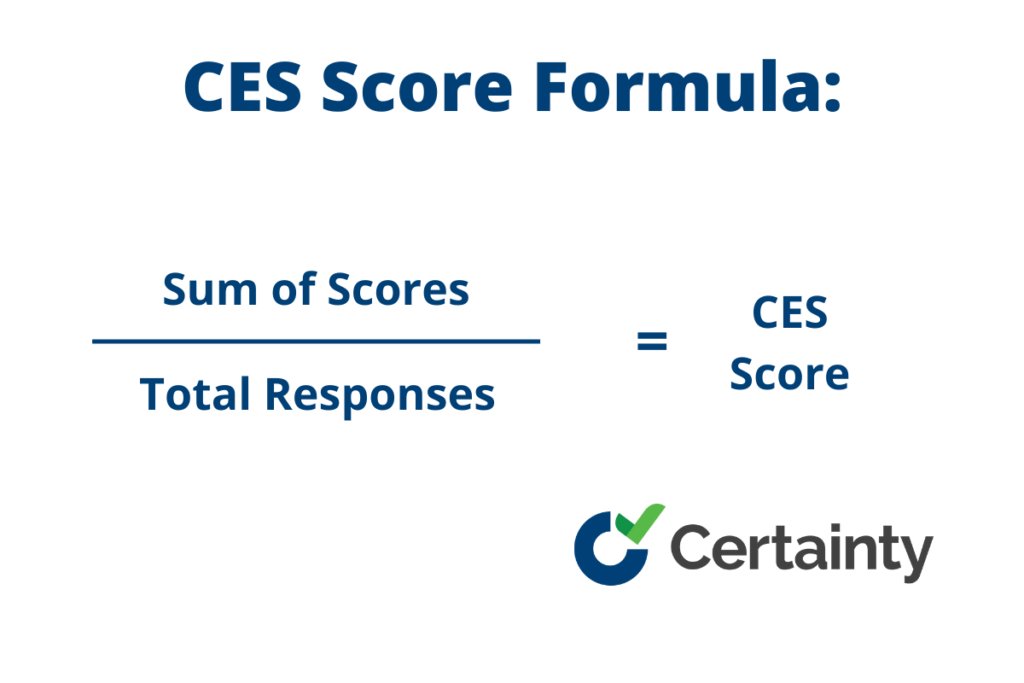
A CES score of 5 or over is considered good, as it is within the net positive range of 5 to 7.
For quality teams, CES highlights friction points in processes such as complaint handling, returns, and corrective action workflows. A high-effort score often points to manual, paper-based processes that slow resolution times. Lead Auditors and Process Improvement Leads can use CES data to build the business case for digitizing quality workflows, reducing time to resolution and audit fatigue across sites.
Turning Customer Satisfaction Data into Quality Action
Quality Managers and Plant Managers who integrate NPS, CSAT, and CES into their quality management systems gain a powerful feedback loop. When customer satisfaction scores decline, they serve as early-warning triggers for CAPA processes. By cross-referencing satisfaction data with internal metrics such as non-conformance rates and audit findings, quality leaders can pinpoint systemic issues, allocate resources effectively, and demonstrate measurable improvement to auditors and stakeholders. Whether your organization operates under ISO 9001, VDA 6.3, or IATF 16949, embedding customer satisfaction metrics into your quality dashboard transforms reactive complaint handling into proactive, data-driven quality improvement.
Frequently Asked Questions (FAQs)
How does customer satisfaction measurement support ISO 9001 compliance?
ISO 9001 Clause 9.1.2 requires organizations to monitor customer perceptions regarding the degree to which their needs and expectations have been fulfilled. Metrics like NPS, CSAT, and CES provide documented, repeatable methods for capturing this data, which can be presented during management reviews and certification audits as evidence of continual improvement.
Which customer satisfaction metric is best for quality teams?
Each metric serves a different purpose. NPS measures overall loyalty and quality perception, CSAT gauges satisfaction with specific interactions or products, and CES identifies process friction. Quality Managers often use all three together to get a comprehensive view of customer sentiment tied to quality performance indicators like non-conformance rates and COPQ.
How can NPS and CSAT data drive CAPA actions?
When NPS or CSAT scores drop below established thresholds, quality teams can treat the decline as a trigger for Corrective and Preventive Action. By analyzing detractor feedback or low CSAT responses, Quality Engineers can identify root causes, open CAPA records, and track corrective actions through to verified closure, reducing time to resolution.
Can customer satisfaction metrics help reduce audit fatigue?
Yes. By digitizing customer satisfaction surveys and integrating the results into a centralized quality management platform, organizations can reduce the manual effort associated with collecting, analyzing, and reporting customer feedback. This streamlined approach lowers the burden on quality teams during internal and external audits, enabling cross-site comparability and faster reporting.
How often should quality teams measure customer satisfaction?
The frequency depends on your industry and customer interaction volume. Many quality-focused organizations survey customers after key touchpoints such as product delivery, service resolution, or complaint closure. At a minimum, quarterly measurement aligns with management review cycles required by ISO 9001, IATF 16949, and similar standards, ensuring satisfaction trends are reviewed alongside audit completion rates and non-conformance data.
You may also be interested in:
Longo’s Wins RCC’s 2022 Excellence in Retailing Award
Targeting Total Quality: How a Total Quality Management Audit Can Help
Quality Audit Software Solutions

Spend Time On Prevention
Not Paperwork
Watch our overview video to see how your organization can benefit from Certainty.
Watch Video