
Summary: Safety metrics turn workplace safety from guesswork into a measurable management system by showing where incidents, delays, and unresolved hazards are actually occurring. Tracking TRIR, DART, LTIFR, near misses, and time to resolution gives EHS managers both lagging and leading indicators they can use to prevent injuries, support OSHA compliance, and strengthen ISO 45001 performance. The real value of safety KPIs is faster corrective action and clearer prioritization of risk reduction efforts.
Safety metrics are quantifiable measures used to track and evaluate the effectiveness of a workplace safety program. The five most important safety metrics every organization should monitor are: Total Recordable Incident Rate (TRIR), Days Away Restricted or Transferred Rate (DART), Average Time to Resolution of Issues, Lost Time Injury Frequency Rate (LTIFR), and Near Miss Rates. Together, these KPIs give EHS managers and safety directors a complete picture of both reactive outcomes and proactive performance — supporting OSHA compliance, ISO 45001 alignment, and continuous improvement goals.
Safety metrics make this possible. By measuring and tracking key performance indicators (KPIs), you can identify areas in need of improvement and create plans that achieve those goals. In this piece, we look at the top 5 safety metrics your business should track to reduce workplace risk, maintain regulatory compliance, and build a stronger safety culture.
Why Safety Metrics Matter
Safety KPI metrics allow organizations to understand what’s happening across operations — and why. Without hard data, trends in incident rates remain speculation rather than fact. Safety professionals risk spending time and resources solving the wrong problems. OSHA’s data-driven approach to safety management, reinforced by standards such as ISO 45001:2018, makes clear that systematic measurement is foundational to any credible health and safety management system (HSMS).
By measuring and analyzing specific data related to incident rates, your safety teams can identify both general trends and pinpoint areas that require targeted improvement. According to the National Safety Council, workplace injuries and illnesses cost U.S. employers over $167 billion in 2022 — a figure that underscores just how much effective safety measurement can protect your bottom line. Put simply: the more data you have, the better positioned you are to act on it.
The Top 5 Safety Metrics
The nature of business operations means there’s almost an infinite number of metrics you could measure, depending on your current needs and safety objectives. While the most critical safety KPIs will vary by industry and workforce challenges, the following five metrics provide meaningful insight for any organization — from construction and manufacturing to healthcare and logistics.
1) Total Recordable Incident Rate (TRIR)
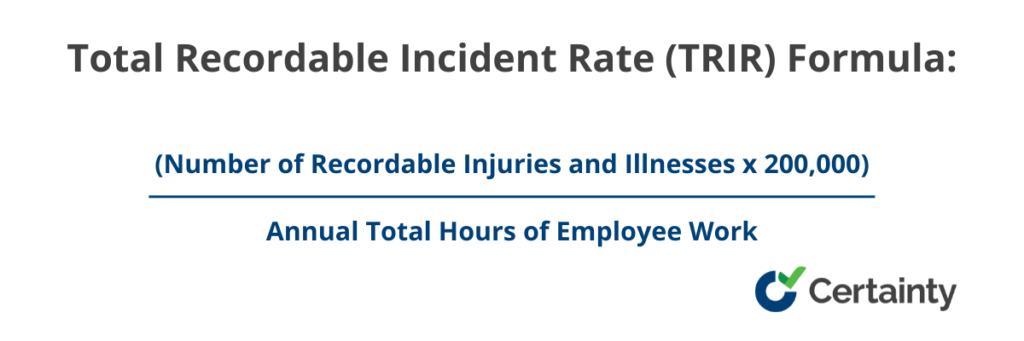
The OSHA TRIR measures the total number of recordable safety incidents and injuries across your business in a given period, normalized per 100 full-time employees. OSHA requires employers to record incidents on Form 300 when they result in any of the following:
- Loss of consciousness
- Worker activity is restricted due to an incident or they must be transferred to a different job
- Staff must take days away from work due to an incident
- Injuries sustained cannot be treated with first aid alone
- A medical professional diagnoses a work-related health condition
To ensure you’re effectively tracking TRIR, it’s critical to implement safety management systems that prioritize consistent incident reporting. A low TRIR signals a healthy safety program; a rising TRIR is an early warning that your safety processes need attention. Benchmarking your TRIR against OSHA industry averages helps contextualize your performance and supports regulatory audit readiness.
2) Days Away, Restricted or Transferred Rate (DART)
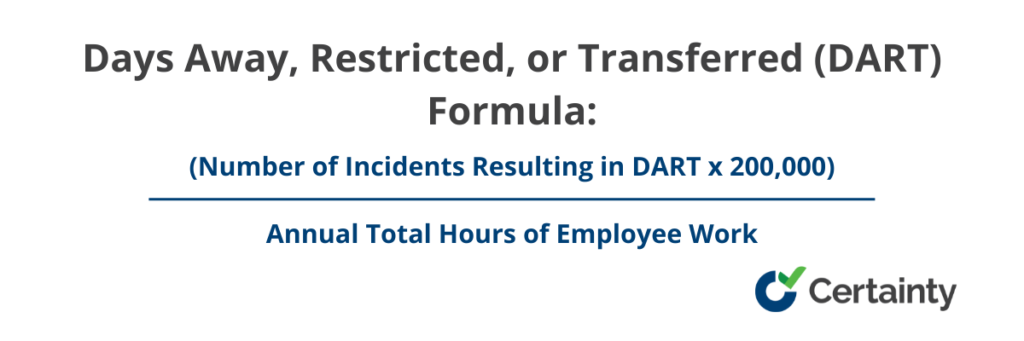
OSHA’s DART rate measures the number of days an employee is away from their job, on restricted or light duties, or temporarily transferred to another role as a result of a work-related injury or illness. The DART rate is a subset of TRIR and provides a more granular view of incident severity. A high DART rate strongly suggests a systemic safety issue — whether related to equipment, processes, training gaps, or environmental conditions — that must be addressed to protect workers and reduce operational disruption.
3) Average Time to Resolution of Issues
How quickly does your organization close out identified safety issues and corrective actions? This metric tracks the average elapsed time between hazard detection and verified resolution. A high average time to resolution means that workers continue to be exposed to known risks — increasing the probability of a recordable incident. Under ISO 45001:2018 Clause 10.2, organizations are required to take corrective action and evaluate the effectiveness of those actions. Monitoring resolution time ensures accountability and keeps your corrective action program from becoming a backlog of unaddressed hazards.
4) Lost Time Injury Frequency Rate (LTIFR)
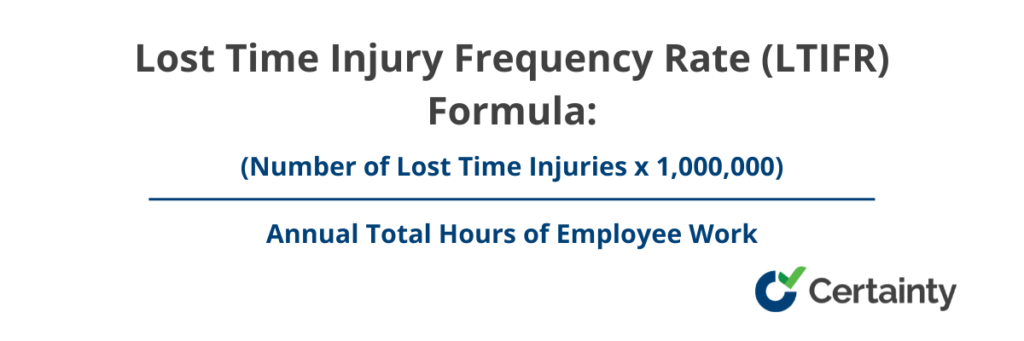
This metric measures the frequency of injuries that result in lost work time, expressed per 1,000,000 hours worked. For example, if your team worked 1,500,000 hours over the measurement period and there were 10 lost-time incidents, your LTIFR is 10 × 1,000,000 ÷ 1,500,000 = 6.67. Tracking LTIFR over time reveals whether safety investments are producing results — a declining LTIFR indicates improving safety culture and effectiveness, while an increasing LTIFR warrants immediate investigation and corrective action.
5) Near Miss Rates
Near miss tracking is one of the most powerful leading indicators available to safety teams. A near miss is an unplanned event that did not result in injury, illness, or damage — but had the potential to do so. For example, if an employee slips while carrying materials but catches themselves before falling, that event should be recorded. Research consistently shows that for every serious injury, there are dozens of near misses and hundreds of unsafe conditions that precede it — a pattern described by Heinrich’s Triangle. High near miss reporting rates actually indicate a healthy safety culture, where workers feel empowered to report hazards. Low near miss reporting, on the other hand, may signal underreporting and hidden risk. Tracking and acting on near miss data is critical for preventing future incidents before they escalate.
Using Metrics to Make Your Business Safer
Effective use of safety metrics helps build a proactive safety culture rather than a reactive one. When LTIFR is tracked consistently, safety managers can determine whether current programs are driving real improvement or whether conditions are deteriorating. When TRIR and DART rates are benchmarked against OSHA industry averages, organizations can set evidence-based improvement goals that align with regulatory expectations. These metrics also form the foundation of safety training initiatives — enabling corrective actions that are targeted, measurable, and effective. Under frameworks like ISO 45001, regular measurement and review of safety performance data is not just best practice; it is a core requirement of continual improvement.

30+ Audit and inspection checklists free for download.
To leverage safety metrics, you need reliable data about the current state of safety in your organization. This starts with systematic data gathering through structured tools and inspection programs. By using resources such as a behavioral-based safety observation checklist or a facility safety inspection checklist, you can identify potential hazards and areas of safety concern that require further analysis — setting the stage for targeted metrics monitoring, focused safety training, and measurable continuous improvement across your operations.
You may also be interested in:
The Difference Between Leading and Lagging Safety Indicators
4 Steps to Perform a Workplace Safety Inspection
Software Solutions for Safety Inspections
Frequently Asked Questions (FAQs)
What is the difference between a leading and lagging safety metric?
Lagging safety metrics — such as TRIR, DART, and LTIFR — measure incidents that have already occurred. They tell you how safe your workplace has been. Leading safety metrics — such as near miss rates, safety observation completion rates, and training pass rates — measure proactive safety activities and are predictive of future incidents. Best-practice safety programs track both types to get a complete picture of safety performance.
How often should safety metrics be reviewed?
Safety KPIs should be reviewed at minimum on a monthly basis, with real-time dashboards providing ongoing visibility between formal reviews. OSHA requires annual submission of injury and illness data (Form 300A) for qualifying employers. For high-hazard industries such as construction, manufacturing, and oil and gas, more frequent review cycles — weekly or even daily — are recommended to catch emerging trends before they escalate.
What is a good TRIR score?
A “good” TRIR varies by industry. According to OSHA data, the average TRIR across all industries is approximately 2.7 recordable incidents per 100 full-time employees. High-hazard industries such as construction and manufacturing typically have higher averages, while office-based industries trend lower. Organizations should benchmark their TRIR against their specific industry average and set annual improvement targets to drive continuous reduction.
How can safety management software help with metrics tracking?
Safety management software like Certainty centralizes incident reporting, inspection data, corrective action tracking, and audit results in one platform — giving EHS teams real-time visibility into all five key safety metrics. Automated dashboards eliminate manual data aggregation, reduce reporting errors, and provide the audit-ready documentation required for OSHA compliance and ISO 45001 certification audits.