
Summary: Leading and lagging safety indicators work together to show both future risk and past performance within a safety management system. Leading indicators measure preventive activity like inspections, training, and hazard reporting, while lagging indicators track results such as injuries, recordables, and lost time incidents. For EHS managers, using both types of safety indicators creates a more complete view of safety performance and supports smarter prevention decisions.
Table of contents

Leading and lagging safety indicators are two complementary categories of safety performance metrics: leading indicators are proactive, predictive measures that signal future risk, while lagging indicators are reactive, historical measures that record past incidents. Together, they form the foundation of any effective occupational health and safety (OHS) management system — including those aligned with OSHA requirements and ISO 45001:2018. The difference between organizations that merely react to safety events and those that consistently prevent them often comes down to how well they understand and use both types of indicators.
According to OSHA, employers with effective safety and health management systems can reduce workplace injuries and illnesses by up to 40%. That figure is backed by decades of data — and it highlights why mastering both leading and lagging indicators is so critical for EHS managers, safety directors, and compliance officers who want to protect their workforce and their bottom line.
Beyond regulatory compliance and cost reduction, organizations that excel at using safety indicators build cultures of continuous improvement. They don’t wait for incidents to reveal problems — they use data to anticipate and prevent them, driving efficiency, reducing liability, and demonstrating a genuine commitment to worker well-being.
What are Leading and Lagging Safety Indicators?
Safety indicators are quantifiable measures that guide how an organization manages workplace health and safety risk. Think of them as two lenses on the same system: one looking backward at what has already happened, the other looking forward to anticipate what might happen next. Both are essential components of a balanced, data-driven safety management system.
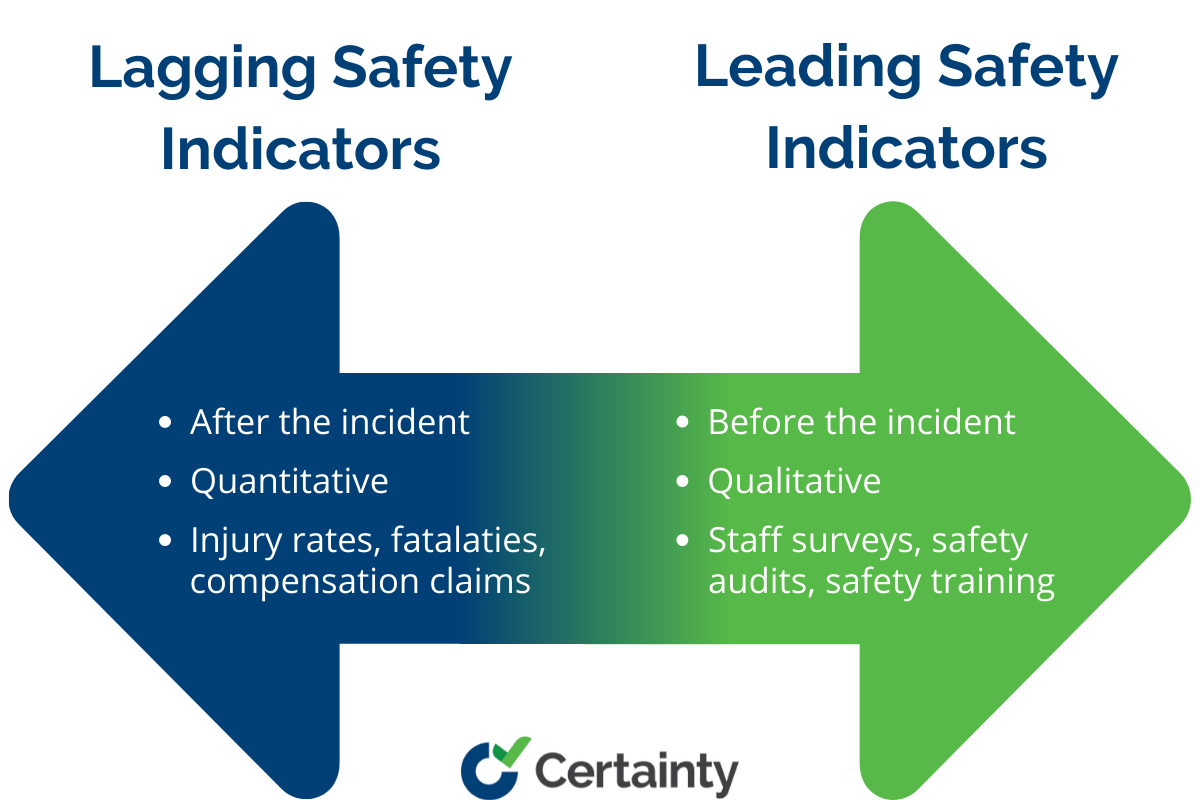
Lagging Safety Indicators
Lagging safety indicators are retrospective metrics that record safety outcomes after incidents have occurred. Common lagging indicators include Total Recordable Incident Rate (TRIR), Lost Time Injury Frequency Rate (LTIFR), Days Away Restricted or Transferred Rate (DART), the number of OSHA-recordable illnesses, and workers’ compensation costs. These measures provide a concrete historical record of safety performance — showing where incidents have happened, how frequently, and with what severity.
Far from being passive historical artifacts, lagging indicators are powerful analytical tools. They reveal patterns, highlight persistent hazard areas, and expose systemic gaps in safety programs. When analyzed over time, they allow organizations to determine whether safety interventions are producing measurable results — and provide the evidence needed to drive proactive, targeted improvements that prevent recurrence.
Leading Safety Indicators
Prevention is the cornerstone of effective workplace safety management. Leading safety indicators are proactive, forward-looking measures that assess the health of your safety program before incidents occur.

Leading indicators measure safety activities and conditions that predict future incident rates — things like safety training completion rates, inspection frequency, near-miss reporting rates, corrective action closure times, and employee safety engagement scores. They give EHS teams the ability to identify and address hazards before workers are harmed.
Activities such as toolbox talks, scheduled safety audits, Job Hazard Analysis (JHA) reviews, and behavioral safety observations are all leading indicator inputs. By tracking and improving these upstream activities, organizations build a safety culture that reduces slips, trips, falls, and more serious incidents — supporting long-term OSHA compliance and ISO 45001 continual improvement requirements.
How do Leading and Lagging Safety Indicators Differ?
The most fundamental difference between leading and lagging safety indicators is timing. Lagging indicators measure what has already happened — they are the outcome. Leading indicators measure what is happening now and what is likely to happen — they are the input. This temporal distinction has major practical implications for how EHS teams structure their safety programs.
The nature of measurement also differs significantly. Lagging indicators tend to be highly quantitative and objective: exact counts of injuries, days lost, OSHA recordables, and compensation costs. Leading indicators often involve a mix of quantitative data (number of inspections completed, training pass rates) and qualitative input (employee safety perception surveys, hazard observation reports). Lagging indicators tell you the score; leading indicators tell you how the game is being played — and where you’re most likely to win or lose.
Where are Leading and Lagging Indicators Similar?
Despite their differences, leading and lagging indicators share a single overarching purpose: Making your business safer.
Lagging indicators document what has already occurred. They are an accurate historical record — but they cannot change the past. A rising TRIR or LTIFR does not undo the harm that has already been done to workers. And for severe incidents, the costs — financial, legal, and human — can be significant and long-lasting.
This reality underscores the importance of acting on lagging data quickly and decisively. Even after incidents have occurred, organizations that analyze root causes systematically — using tools like incident investigation frameworks and corrective action plans — can prevent recurrence and protect future workers.
Leading indicators address the other side of the equation: What might happen next? They equip safety teams with early warning signals and actionable data that enable proactive safety management. In high-hazard industries such as construction, oil and gas, and manufacturing, the ability to detect and correct hazards before incidents occur is not just a competitive advantage — it is a legal and ethical obligation.
Where leading indicators have a limitation, however, is in providing hard evidence of impact. Safety surveys and audit completion numbers show that activities are happening — but without correlating them to lagging indicator data, it can be difficult to prove that those activities are reducing incidents.
The most resilient safety programs use both types together: lagging indicators to understand where the risks are greatest and leading indicators to deploy proactive interventions. Together, they enable organizations to identify high-risk areas with precision, address root causes systematically, and demonstrate the value of their safety investments through measurable, improving outcomes.
Examples of Leading and Lagging Indicators in Action
In the construction industry, safety indicators can work together to significantly improve safety outcomes. A study published in Safety Science examined the relationship between leading and lagging indicators across 47 construction projects. Researchers used site inspection frequency and toolbox talk rates as leading indicators, and first-aid injury rates and recordable injury counts as lagging indicators. Statistical modeling was used to determine whether higher leading indicator activity correlated with lower lagging indicator outcomes.
The study found a significant inverse relationship: projects with more frequent site inspections and toolbox talks recorded fewer first-aid injuries compared to projects with lower rates of these proactive activities. This real-world evidence reinforces what OSHA and ISO 45001 both advocate — that consistent safety activity upstream directly reduces harm downstream.
The study’s findings have direct implications for how safety managers should design their measurement programs. Tracking leading indicators such as the number of safety inspections completed, toolbox talks delivered, near misses reported, and corrective actions closed out provides the upstream data needed to influence lagging outcomes like injury frequency and severity. The combination creates a feedback loop that drives continuous improvement.
For example, if leading indicator data shows that site inspection rates have dropped over a two-month period, a safety manager can investigate and address the cause before lagging indicators — rising TRIR or DART rates — reflect the impact. This is the real power of using both types of indicators together: the ability to course-correct before harm occurs, rather than after.


30+ Audit and inspection checklists free for download.
How to Combine Leading and Lagging Indicators for Better Safety Outcomes
Here are practical steps to help you integrate leading and lagging indicators into a cohesive safety performance system:
- Start with your lagging indicators and identify which ones matter most to your strategic safety goals. If reducing lost-time injuries is the priority, begin with the Lost Time Injury Frequency Rate (LTIFR) as your primary outcome metric.
- Identify the leading indicators that most directly influence your target lagging metrics. To drive down LTIFR, track leading inputs such as safety inspection completion rates, number of hazard observations submitted, toolbox talk attendance, and corrective action closure rates — all of which reflect the quality and consistency of your safety program.
- Build a safety dashboard that displays both leading and lagging indicators side by side. A balanced scorecard approach — aligned with ISO 45001 Clause 9.1 performance evaluation requirements — allows you to see correlations between upstream safety activity and downstream safety outcomes at a glance.
- Analyze trends and correlations between your leading and lagging data sets. Tools such as Excel, Tableau, or purpose-built safety software can generate charts and statistical models that show how changes in leading indicator performance affect lagging outcomes over time.
- Take data-driven corrective action. If a particular leading indicator — such as PPE compliance rates during safety inspections — shows a strong correlation with lower injury frequency, allocate additional resources there. If a leading indicator shows no relationship to outcomes, reconsider whether it is the right measure for your operational context.
- Review and update your indicators regularly to ensure they remain relevant, reliable, and aligned with your current safety objectives. At minimum, conduct a formal review of your indicator set annually — or whenever your operations, regulatory environment, or risk profile changes significantly.
Enhancing Safety with Certainty Software
Certainty Software is purpose-built to help EHS teams manage both leading and lagging safety indicators with confidence. The platform streamlines data collection by enabling workers to record safety observations, complete inspection checklists, submit near-miss reports, and participate in safety audits in real time — from any device, on any job site. This drives participation, ensures data accuracy, and gives safety managers the up-to-date information they need to act quickly on emerging risks.
With Certainty, safety teams gain powerful analytics and reporting capabilities that surface trends, highlight correlations between leading and lagging indicators, and identify areas for targeted improvement. Real-time dashboards eliminate manual data aggregation and give leadership the visibility they need to make informed, evidence-based safety decisions at every level of the organization.
Certainty also automates corrective action assignment and tracking — converting insights from leading indicator data into verified improvements in lagging outcomes. It supports compliance with OSHA recordkeeping requirements, ISO 45001 performance evaluation clauses, and industry-specific safety standards, while providing the audit-ready documentation needed for regulatory inspections and third-party certifications.
Ready to experience the power of Certainty Software for yourself? Book a demo today to see how it can transform your safety management.
Try our free Facility Safety Inspection Checklist.
You may also be interested in:
PPE Inspections: What They Are and Why You Need Them
Field Level Hazard Assessments: What They Are (And Why They Matter)
Safety inspection software solutions
Frequently Asked Questions (FAQs)
What is the main difference between leading and lagging safety indicators?
The main difference is timing and orientation. Lagging indicators measure past safety outcomes — injuries, illnesses, lost work days — and tell you how safe your workplace has been. Leading indicators measure proactive safety activities — inspections completed, near misses reported, training participation rates — and predict how safe your workplace is likely to be. Effective safety programs track both to manage risk comprehensively.
What are examples of leading safety indicators?
Common leading safety indicators include: safety inspection completion rates, near-miss reporting frequency, toolbox talk attendance, corrective action closure time, PPE compliance rates during audits, safety training participation and pass rates, Job Hazard Analysis (JHA) completion rates, and employee safety perception survey scores.
What are examples of lagging safety indicators?
Common lagging safety indicators include: Total Recordable Incident Rate (TRIR), Lost Time Injury Frequency Rate (LTIFR), Days Away Restricted or Transferred Rate (DART), number of OSHA-recordable incidents, workers’ compensation costs, and fatality rates. These metrics are reported on OSHA Form 300 and Form 300A and are used for industry benchmarking and regulatory compliance.
Are leading or lagging indicators more important?
Neither type is more important in isolation — they are most powerful when used together. Lagging indicators confirm whether your safety program is producing results. Leading indicators give you the ability to improve those results before incidents occur. ISO 45001:2018 explicitly requires organizations to monitor and measure both leading and lagging performance data as part of their safety management system.