
Summary: A Turtle Diagram is a visual quality management tool that maps the inputs, outputs, resources, and controls of any process in a simple, intuitive format. It is widely used during ISO 9001, IATF 16949, and VDA 6.3 process audits to evaluate whether processes are adequately defined, resourced, and performing as intended. By breaking complex QMS processes into clear components, Turtle Diagrams help quality teams identify gaps, improve audit preparation, and drive more effective corrective actions.
Table of contents
Quality management is an essential component of any business. Moreover, its significance continues to grow with time. To ensure quality, organizations use various tools and techniques to manage their processes and minimize errors. However, the complexity of these processes can make it difficult for Quality Engineers and QA Managers to understand them effectively. This is where the Turtle Diagram comes in. Although turtles may be considered slow, utilizing a Turtle Diagram in Quality Management Systems can significantly accelerate the comprehension of intricate processes. In other words, it turns complex workflows into clear, visual maps. Let’s dive into what a Turtle Diagram is and how it can benefit your quality team.
What is a Turtle Diagram?
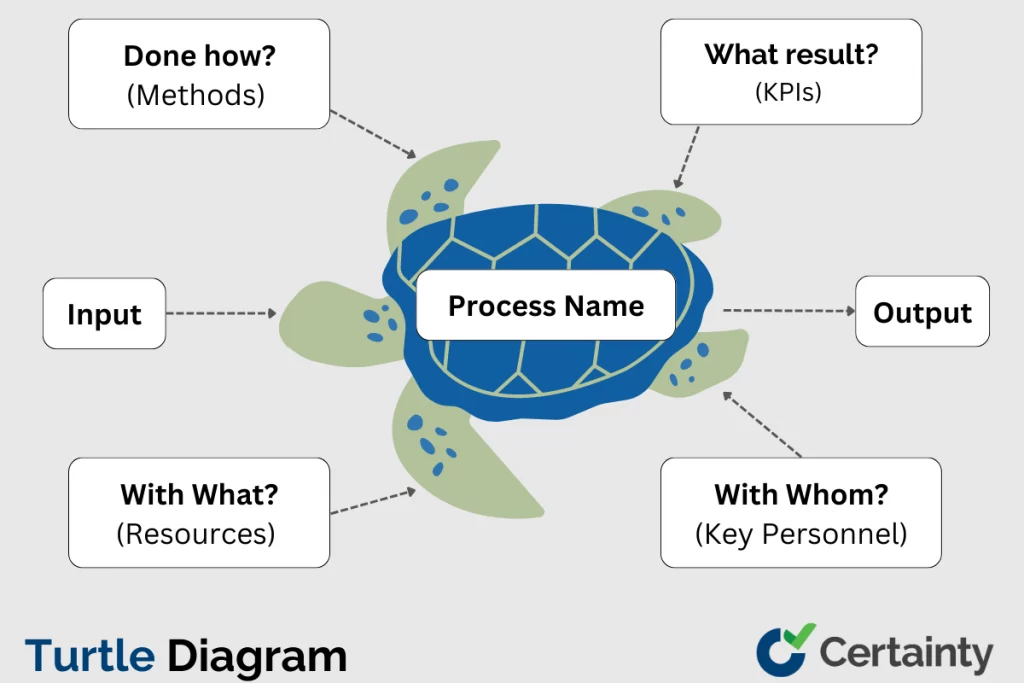
A Turtle Diagram is a visual tool used to represent your quality management system (QMS) processes. Specifically, it is a simple yet effective method developed by Philip Crosby that helps organizations understand and manage a process effectively. Quality teams widely use it during ISO 9001 and IATF 16949 process audits. In particular, the Turtle Diagram breaks down a process into five questions:
- What inputs?
- What output?
- Done How?
- What result?
- With What?
- With whom?
What does a Turtle Diagram Show?
A Turtle Diagram provides a graphical representation of the entire process. Specifically, it highlights the inputs, outputs, support processes, and interested parties. It allows organizations to visualize the process flow and identify any gaps or inefficiencies. As a result, teams can streamline QMS process improvement more effectively. Completing one ensures that each step in the process adds value to the final product or service. Additionally, it confirms alignment with customer requirements.
For QA Managers and Process Improvement Leads, the Turtle Diagram is an invaluable audit preparation tool. It provides auditors with a clear, structured view of how each process operates. Furthermore, it shows how quality is measured at every stage.
The Elements of a Turtle Diagram
You may find understanding the elements of the Turtle Diagram easier by asking five key questions. Specifically, these questions cover the input, output, supporting processes, and interested parties.
What Inputs?
The inputs in a Turtle Diagram represent the resources needed to initiate the process. This includes the equipment, raw materials, information, and people required. Moreover, inputs must meet the process requirements and customer needs. For instance, in the sourcing process, the inputs may include supplier information, contract documents, and specifications.
What Output?
The output is the end product or service that the process produces. Most importantly, these must meet the customer’s requirements and expectations. For example, the output in a manufacturing process could be a finished product. Similarly, in a service-oriented process, it could be a service report.
Done how?
This question requires a detailed description of the process steps and tasks. Specifically, it seeks to identify the actions necessary to achieve the desired process outcome. Answering this question requires a clear understanding of the process flow and the sequence of activities involved.
For example, in a manufacturing process, the “Done how?” question might require a step-by-step breakdown. This includes details about the equipment, tools, and materials used. Additionally, it covers any quality checks or inspections that occur along the way.
What result?
The “What result?” question is a critical component of the Turtle Diagram. It focuses on the outputs or results of the process. In many cases, teams measure these results using KPIs. These are quantitative or qualitative metrics that evaluate the success of a process. For quality teams, this is where key metrics such as First Pass Yield (FPY), non-conformance rates, and Cost of Poor Quality (COPQ) come into play.
It’s important to identify the specific KPIs relevant to the process. For example, a manufacturing process might track production yield, defect rates, or equipment uptime. In contrast, a customer service process might track customer satisfaction or first-call resolution rates. Furthermore, Quality Engineers should ensure the selected KPIs align with the organization’s broader quality objectives and ISO 9001 or IATF 16949 requirements.

30+ Audit and inspection checklists free for download.
With what?
This question focuses on the resources required to carry out the process. Specifically, it asks what equipment, tools, materials, or software are needed. For example, in a logistics process, the “With what?” question might require a list of trucks, warehouses, and other resources. Additionally, it might require a description of any software used to track inventory or shipments.
For quality-focused processes, this often includes digital audit tools and inspection software. Moreover, it covers corrective action management platforms that replace paper-based systems.
With whom?
This element relates to the people or organizations involved in the process. It asks who carries out each process step and identifies the stakeholders. In addition, it clarifies their needs and expectations.
For example, in a customer service process, this might include a list of customer service representatives. It also covers any external stakeholders, such as customers or regulatory bodies. Similarly, in a quality audit process, this would include the QA Manager, Lead Auditor, Quality Supervisors, and any external certification body auditors.
How to complete a Turtle Diagram
Get started by downloading our free Turtle Diagram Template.
Here’s a quick 8-step approach to completing a Turtle Diagram:
- Identify the process to be evaluated and the process owner.
- Gather all relevant information, such as inputs, outputs, and support processes.
- Map out the process using a process map or flowchart.
- Identify the interested parties and their needs and expectations.
- Determine the performance indicators or metrics that will be used to measure the process’s success.
- Analyze the process for risks and opportunities for improvement.
- Perform internal audits using quality audit checklists such as Certainty’s GMP Audit Checklist for identifying nonconformity and implementing corrective actions needed to improve the process.
- Review the turtle diagram in the management review process and implement continual improvement.
Discover how Certainty is the quality audit software solution.
Frequently Asked Questions (FAQs)
What is the purpose of a Turtle Diagram in a QMS audit?
A Turtle Diagram serves as a structured framework for auditing individual processes within a quality management system. During ISO 9001 or IATF 16949 audits, Lead Auditors and Quality Engineers use Turtle Diagrams to systematically evaluate process inputs, outputs, resources, personnel, methods, and performance indicators. This ensures no aspect of the process is overlooked and provides a clear, auditable record of how each process is controlled and measured.
How does a Turtle Diagram differ from a process flowchart?
While a process flowchart shows the sequential steps within a process, a Turtle Diagram provides a holistic view of the process by capturing the resources, personnel, methods, and KPIs associated with it. A flowchart answers “what happens in what order,” whereas a Turtle Diagram answers “what goes in, what comes out, how it is done, with what resources, by whom, and how success is measured.” Quality teams often use both tools together for comprehensive process documentation.
Which quality standards require or recommend Turtle Diagrams?
Turtle Diagrams are widely used in ISO 9001, IATF 16949, and VDA 6.3 process audits. While not explicitly mandated by the standards themselves, they are a recognized best practice for documenting and auditing QMS processes. Many certification bodies and Lead Auditors expect to see Turtle Diagrams as part of the process audit evidence, particularly in automotive manufacturing where IATF 16949 compliance is required.
What KPIs should be included in the “What result?” section of a Turtle Diagram?
The KPIs included should be specific to the process being documented. Common quality KPIs include First Pass Yield (FPY), non-conformance rates, defect rates (PPM), audit completion rates, corrective action closure time, and Cost of Poor Quality (COPQ). QA Managers should select KPIs that align with the organization’s quality objectives and provide actionable data for driving continuous improvement.
Can Turtle Diagrams be managed digitally instead of on paper?
Yes, and digital management is strongly recommended. Paper-based Turtle Diagrams are difficult to update, share, and audit across multiple sites. Digital quality management platforms allow QA Managers and Process Improvement Leads to create, store, and update Turtle Diagrams centrally, link them to audit checklists and corrective action workflows, and ensure cross-site comparability. This eliminates version control issues and provides real-time access for all stakeholders, from shop floor supervisors to VP Quality Assurance.

Spend Time On Prevention
Not Paperwork
Watch our overview video to see how your organization can benefit from Certainty.
Watch Video