
Summary: Lagging indicators measure incidents and losses that have already occurred, making them essential for understanding historical safety performance and identifying recurring risk patterns. For safety managers, metrics such as recordable injuries, lost time, and severity rates provide the baseline needed to evaluate whether controls are working. Lagging indicators are most useful when they inform root cause analysis and corrective action instead of serving as standalone scorecards.
U.S. employers reported approximately 2.6 million nonfatal workplace injuries and illnesses in 2023, according to the U.S. Bureau of Labor Statistics (BLS). And while injury rates have trended downward over the long term, the financial and human costs remain staggering. The National Safety Council estimates workplace injuries cost employers over $167 billion annually in wage and productivity losses, medical expenses, and administrative costs — with more than 100 million productive work days lost each year. Lagging safety indicators are the primary tool organizations use to evaluate historical incident trends, identify systemic risk, and build safety programs that reduce these costs over time.
In this piece, we’ll explore what lagging indicators are, the most common types, their benefits and limitations, and how organizations can effectively track and act on lagging safety data to build safer, more compliant workplaces.
What are Lagging Indicators?
Lagging safety indicators are retrospective metrics that record incidents and adverse outcomes that have already occurred in the workplace. These safety performance measures provide the historical foundation for future safety protocols — establishing baselines, revealing trends, and identifying the types of incidents that are most common or most severe in a given operational context.
Consider injury frequency data collected over a 12-month period. If lagging indicators show that recordable injury rates are trending upward — particularly in a specific department or for a specific type of task — that data gives safety managers and EHS directors the evidence they need to investigate root causes, implement targeted corrective actions, and measure whether those actions are producing results. Under OSHA’s recordkeeping requirements (29 CFR Part 1904), employers are legally required to track and report many of these lagging metrics annually, making them both a compliance obligation and a strategic safety management tool.
What are the Most Common Types of Lagging Safety Performance Indicators?
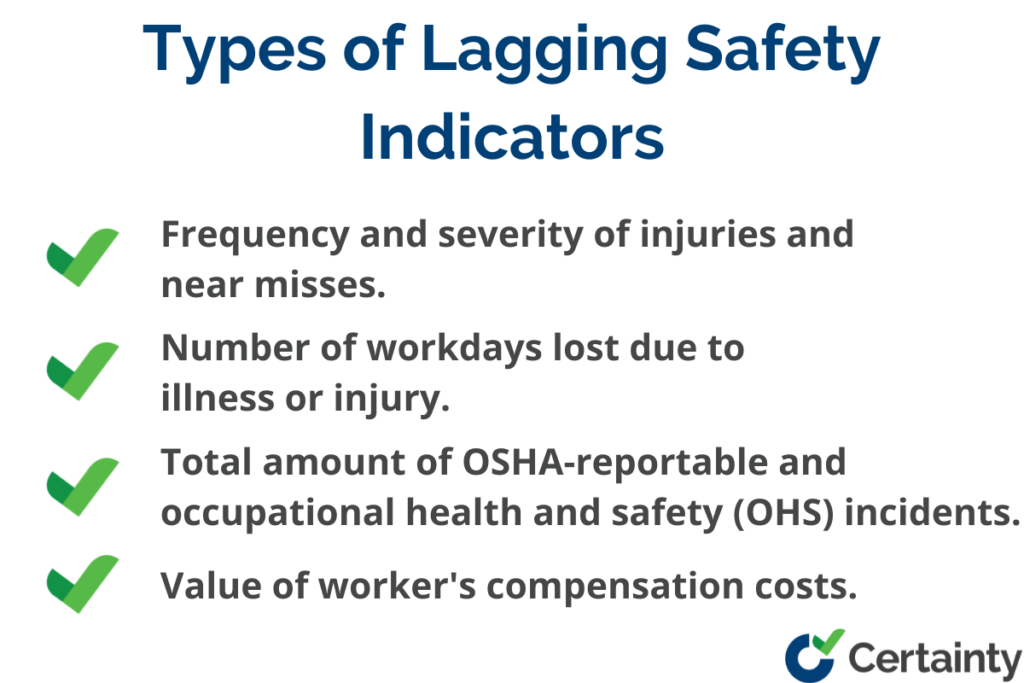
While the specific nature of lagging indicator data varies by industry, hazard profile, and regulatory environment, four broad categories are universally applicable across organizations:
- Frequency and severity of injuries and near misses
This category includes the Total Recordable Incident Rate (TRIR), Lost Time Injury Frequency Rate (LTIFR), and the frequency of near-miss events. TRIR, calculated per 100 full-time employees, is the most widely used lagging indicator for benchmarking against OSHA industry averages. Severity data — such as the Days Away Restricted or Transferred (DART) rate — adds context by distinguishing between minor recordable injuries and those significant enough to affect worker availability and productivity.
- Number of workdays lost due to illness or injury
Lost workday metrics directly quantify the operational impact of workplace incidents. High lost-time figures not only indicate serious injury severity — they signal resource gaps that affect project timelines, team capacity, and overall productivity. Organizations with high DART rates often find that the indirect costs of absenteeism — rescheduling, temporary staffing, and reduced output — far exceed the direct medical costs of the incident itself.
- Value of worker’s compensation costs
Workers’ compensation costs are one of the most financially significant lagging indicators. Rising compensation costs over successive measurement periods are a reliable signal that workplace environments are becoming more hazardous — or that existing safety controls are not functioning as intended. For risk managers and CFOs, compensation trends are often the metric that drives organizational investment in safety improvement programs.
- Total amount of OSHA-reportable and occupational health and safety (OHS) incidents
The total count of OSHA-recordable incidents, including those requiring medical treatment beyond first aid, job restrictions, and days away from work, is a critical compliance metric. Elevated OSHA-reportable incident counts not only expose organizations to regulatory scrutiny and potential citations — they indicate the presence of persistent hazards that are placing workers at daily risk. Organizations with high OSHA incident counts are also more likely to be selected for OSHA programmed inspections under the Site-Specific Targeting (SST) program.
The Benefits and Drawbacks of Lagging Indicators
Lagging indicators offer a reliable, evidence-based foundation for safety program evaluation. They provide concrete, quantifiable data that enables post-incident risk assessment, trend analysis, and targeted safety improvement planning. For example, if an analysis of slip, trip, and fall injuries over a quarter shows a marked increase — particularly in one facility or work area — that finding is a clear, data-supported directive to investigate conditions and implement corrective controls. This type of evidence is also invaluable during OSHA inspections and ISO 45001 certification audits, where demonstrating systematic performance measurement is a core requirement.
Lagging indicators can also drive targeted safety investment. If data reveals a consistent increase in a specific type of incident — such as musculoskeletal injuries at a particular workstation — organizations can use that information to justify targeted ergonomic improvements, procedural updates, or additional worker training. This data-driven approach to safety spending ensures resources are directed where they have the greatest impact.
The primary limitation of lagging indicators is their reactive nature. Because lagging data is collected after incidents have already occurred, it cannot prevent the harm that generated the data. Safety programs that rely exclusively on lagging indicators are always responding to events rather than preventing them — a posture that accepts some level of worker harm as inevitable. This is why OSHA, ISO 45001, and leading safety researchers all advocate for balancing lagging indicators with proactive leading indicators that enable hazard identification and risk reduction before incidents occur.
Additionally, if lagging indicator data shows no immediate negative trends, organizations may become complacent — interpreting the absence of recorded incidents as evidence that all hazards are under control. This misreads the data: lagging indicators can only tell you about incidents that were reported. Organizations with low near-miss reporting rates, inadequate inspection programs, or a culture of underreporting may have deceptively low lagging indicator scores that mask significant underlying risk.
How to Effectively Track Lagging Safety Data
When it comes to tracking and measuring lagging safety data, the first step is establishing a clear framework for identifying and recording all relevant incidents. A robust facility safety inspection checklist provides a structured starting point — ensuring that all areas of the facility are assessed consistently and that potential hazard sources are documented before they generate recordable incidents. OSHA Forms 300, 300A, and 301 must be completed for all OSHA-recordable incidents and maintained for a minimum of five years, so establishing reliable incident reporting processes is both a legal obligation and a data quality imperative.

30+ Audit and inspection checklists free for download.
Next, organizations should establish a consistent, recurring schedule for safety audits and data review. Whether measurement cycles are weekly, biweekly, or monthly, consistency is critical: irregular data collection produces unreliable trend lines that can mislead safety decision-making. A fixed review cadence also supports OSHA’s recordkeeping requirements and the performance monitoring obligations of ISO 45001 Clause 9.1, which requires organizations to evaluate safety performance against planned objectives at defined intervals.
Finally, organizations must close the loop between lagging data and corrective action. Tracking incidents is only valuable if it drives improvement. When rising workers’ compensation costs or increasing TRIR rates signal a problem, safety managers should convene structured root cause analysis sessions — using frameworks such as the 5 Whys or fishbone diagrams — to identify the underlying causes rather than addressing only surface symptoms. The output of that analysis should feed directly into updated safety training initiatives, revised standard operating procedures, targeted equipment inspections, or additional engineering controls. Without this final step, lagging indicator data remains an administrative record rather than a driver of genuine safety improvement.
You may also be interested in:
4 Steps to Perform a Workplace Safety Inspection
Safety Observation: Five Steps to Reduce Workplace Risk
Safety Inspection Software Solutions
Frequently Asked Questions (FAQs)
What is a lagging safety indicator?
A lagging safety indicator is a retrospective metric that records workplace safety outcomes after incidents have occurred. Common examples include Total Recordable Incident Rate (TRIR), Lost Time Injury Frequency Rate (LTIFR), Days Away Restricted or Transferred Rate (DART), OSHA-recordable incident counts, and workers’ compensation costs. Lagging indicators are used to evaluate historical safety performance, identify incident trends, and measure the impact of safety interventions over time.
What is the difference between a lagging indicator and a leading indicator?
Lagging indicators measure safety outcomes that have already occurred — they are reactive metrics. Leading indicators measure proactive safety activities that occur before incidents — such as inspection completion rates, near-miss reporting frequency, and training participation. Lagging indicators tell you how safe your workplace has been; leading indicators help predict and prevent future incidents. OSHA and ISO 45001 both recommend using a combination of both types for a complete picture of safety performance.
Why are lagging indicators not sufficient on their own?
Lagging indicators only capture incidents that have already been reported and recorded — they cannot prevent the harm that generated the data. Organizations that rely solely on lagging indicators are always reacting to events rather than anticipating them. They are also vulnerable to complacency when lagging metrics appear stable, which may mask underreporting or emerging risks. Pairing lagging indicators with leading indicator tracking provides a more complete and actionable view of workplace safety.
How does safety management software support lagging indicator tracking?
Safety management platforms like Certainty Software centralize incident reporting, OSHA recordkeeping, corrective action tracking, and audit data in a single system. This eliminates manual data entry errors, ensures all reportable incidents are captured in real time, and gives EHS managers instant access to trend analysis and performance dashboards. Automated reporting tools also simplify OSHA Form 300 and 300A completion, reducing administrative burden while improving data accuracy and audit readiness.