
Summary: Overall Equipment Effectiveness (OEE) is a manufacturing metric that measures the percentage of planned production time that is truly productive, combining availability, performance, and quality into a single score. The average manufacturing plant operates at only 60% OEE, meaning 40% of capacity is lost to breakdowns, slowdowns, and defects. Improving OEE directly reduces the cost of poor quality, increases first pass yield, and supports compliance with ISO 9001 and IATF 16949 requirements for monitoring and measurement of production processes.
Table of contents
Did you know the average manufacturing plant operates at only 60 percent of its full potential? That means 40 percent of planned production time is lost to equipment breakdowns, production bottlenecks, quality defects, and other inefficiencies. For QA Managers, Plant Managers, and Quality Engineers responsible for meeting ISO 9001 and IATF 16949 standards, this lost capacity directly impacts non-conformance rates, Cost of Poor Quality (COPQ), and First Pass Yield (FPY). Imagine how productive, profitable, and competitive your manufacturing business could be if you eliminate these losses and optimize your equipment performance.
That’s where OEE, or Overall Equipment Effectiveness, comes in. OEE is a metric that quantifies how effectively a manufacturing process uses its equipment to produce quality products. It helps manufacturers measure, monitor, and improve their manufacturing efficiency in real time, resulting in significant benefits such as reduced costs, enhanced quality, increased customer demand, and improved competitive advantage. For Process Improvement Leads and QA Directors tracking quality KPIs, OEE provides a direct link between equipment performance and measurable quality outcomes.
But what exactly is OEE, and how can it be calculated and optimized for manufacturing operations? This guide provides a comprehensive overview of OEE meaning in manufacturing and shows how quality-focused teams — from Quality Supervisors on the shop floor to VP Quality Assurance leaders setting enterprise-level strategy — can use it to transform business performance.
Understanding OEE
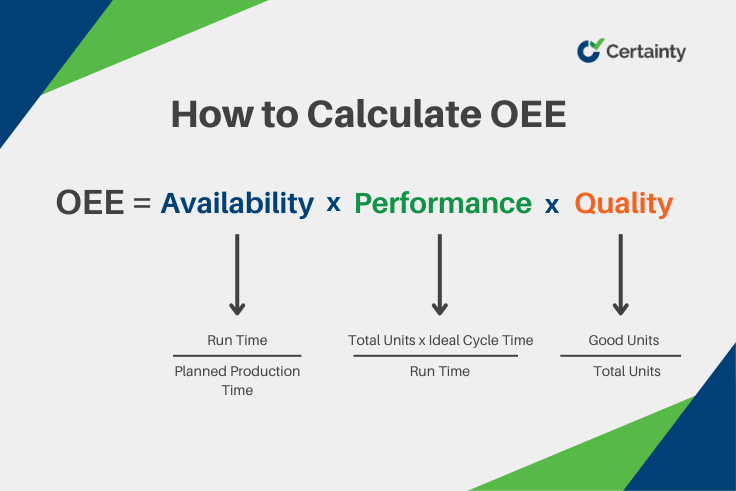
OEE stands for Overall Equipment Effectiveness. It is a metric that quantifies how effectively a manufacturing process uses its equipment to produce quality products. It is calculated by multiplying three factors: Availability, Performance, and Quality.
- Availability measures the percentage of time that the equipment is ready and able to run, excluding planned and unplanned downtime.
- Performance measures the percentage of actual output that the equipment produces compared to its maximum possible output, excluding speed losses.
- Quality measures the percentage of good products that the equipment produces out of the total output, excluding quality defects. This factor directly correlates with First Pass Yield (FPY) and non-conformance rates tracked in quality management systems.
OEE = Availability x Performance x Quality
By multiplying these three factors, OEE provides a holistic view of equipment performance and overall manufacturing efficiency. It reveals how much of the planned production time is truly productive and how much is lost to various inefficiencies. For Quality Engineers and Process Improvement Leads, OEE is a foundational KPI that connects equipment health to product quality outcomes and feeds directly into management review processes required by ISO 9001 and IATF 16949.
OEE can range from 0% to 100%, where 0% means no production at all and 100% means perfect production with no losses. However, achieving 100% OEE is practically impossible in reality, as there will always be some degree of variation and imperfection in any process. A more realistic benchmark for world-class OEE is 85%, which indicates a highly efficient and optimized manufacturing process — one that typically aligns with the continuous improvement expectations of ISO 9001 and IATF 16949 frameworks.

30+ Audit and inspection checklists free for download.
The Significance of OEE in Manufacturing
OEE is more than just a number. It is a powerful indicator of the health and functionality of your manufacturing process. For QA Directors, Plant Managers, and Continuous Improvement teams, tracking and improving OEE delivers measurable business outcomes:
- Reduced production costs: By identifying and eliminating sources of waste and inefficiency in your process, you can lower your operating expenses, reduce Cost of Poor Quality (COPQ), and increase your profit margins.
- Enhanced product quality: By ensuring that your equipment produces consistent and defect-free products, you can improve First Pass Yield (FPY), reduce non-conformance rates, and strengthen customer satisfaction — while supporting compliance with ISO 9001, IATF 16949, and FDA cGMP requirements.
- Increased customer demand: By optimizing your equipment output and throughput, you can meet or exceed customer expectations and delivery schedules, reducing the risk of quality escapes that damage customer confidence.
- Improved competitive advantage: By maximizing your productivity and quality KPIs, you can gain an edge over your competitors and establish your organization as a leader in operational excellence — especially critical in regulated sectors where IATF 16949 or FDA cGMP compliance is a prerequisite for market access.
- Stronger audit readiness: OEE data supports audit completion rates and provides objective evidence for Lead Auditors during internal and external quality audits, reducing audit fatigue and streamlining the documentation process.

Calculating OEE for Manufacturing Operations
Now that you understand what OEE is and why it matters to Quality and Manufacturing Operations teams, you may be wondering how to calculate it for your own processes. The good news is that the OEE calculation is straightforward, as long as you have the right data and formula. Quality Engineers and Process Improvement Leads who already track quality KPIs such as FPY, non-conformance rates, and time to resolution will find that many of the inputs needed for OEE are already captured in their quality management systems.
To calculate OEE, you need to measure four variables:
- Planned Production Time: The total time that your equipment is scheduled to run, excluding planned stops such as breaks, maintenance, and changeovers.
- Run Time: The actual time that your equipment is running, excluding unplanned stops such as breakdowns, power outages, and material shortages.
- Ideal Cycle Time: The fastest possible time that your equipment can produce one unit of output, assuming optimal conditions and speed.
- Total Units: The total number of units that your equipment produces during the run time, including good and defective products.
Using these variables, you can calculate the three factors of OEE:
- Availability = Run Time / Planned Production Time
- Performance = (Total Units x Ideal Cycle Time) / Run Time
- Quality = Good Units / Total Units
Then, you can multiply these factors to get the OEE:
- OEE = Availability x Performance x Quality
OEE Calculation Example
To illustrate how this works, let’s look at a simple example. Suppose you have a manufacturing process that produces widgets. The planned production time for one shift is 8 hours (480 minutes). The run time for the shift is 7 hours (420 minutes), due to 1 hour of unplanned downtime. The ideal cycle time for producing one widget is 1 minute. The total number of widgets produced during the run time is 350, out of which 300 are good and 50 are defective.
Using these data, you can calculate the OEE as follows:
- Availability = 420 / 480 = 0.875 or 87.5%
- Performance = (350 x 1) / 420 = 0.833 or 83.3%
- Quality = 300 / 350 = 0.857 or 85.7%
- OEE = 0.875 x 0.833 x 0.857 = 0.624 or 62.4%
This means that the manufacturing process is operating at 62.4% of its full potential — well below the world-class benchmark of 85%. For a QA Manager or Process Improvement Lead, this gap signals clear opportunities to reduce downtime, improve First Pass Yield, and lower non-conformance rates through targeted corrective actions. A Quality Engineer reviewing this data would note that the Quality factor of 85.7% translates to a 14.3% defect rate, directly impacting COPQ metrics reported during management reviews under ISO 9001.
Strategies to Optimize OEE in Manufacturing
Calculating OEE is only the first step in optimizing your manufacturing efficiency. The next step is to implement strategies that improve your OEE score and support your quality objectives. For QA Managers and Process Improvement Leads, aligning these strategies with existing quality frameworks such as ISO 9001, IATF 16949, or VDA 6.3 ensures that OEE improvements are embedded into the broader quality management system. Here are some of the most effective strategies that Quality, Manufacturing Operations, and Continuous Improvement teams can use:
- Predictive maintenance: Use data and analytics to monitor the condition and performance of your equipment and predict when it needs maintenance or repair. This helps prevent breakdowns, reduce unplanned downtime, and extend equipment lifespan — directly improving the Availability component of OEE.
If you need a checklist template to help compile quality-related audit and inspection data, try our free-to-download Gemba Walk Checklist.
- Process automation: Implement technology such as sensors, robots, and quality audit software to automate repetitive or complex tasks in your manufacturing process. This increases output, speed, and accuracy while reducing human errors and variability — key factors in improving FPY and reducing non-conformance rates. Replacing paper-based audits and manual corrective action processes with digital workflows is a critical first step.
- Equipment upgrades: Invest in new or improved equipment that enhances your manufacturing capabilities and efficiency. Modern equipment with built-in quality sensors helps you produce more products with fewer resources, less time, and reduced waste.
- Workforce engagement: Motivate and empower your employees to participate in improving your manufacturing process and OEE performance. This fosters a culture of continuous improvement aligned with ISO 9001 principles, encouraging collaboration between Quality, Operations, and Maintenance teams.
- Training and education: Provide your employees with the necessary skills and knowledge to operate and maintain equipment effectively and safely. Well-trained operators contribute to fewer quality defects, faster time to resolution on corrective actions, and higher audit readiness.
- Best practices and standards: Adopt proven methods and guidelines for optimizing your manufacturing process and OEE performance. Aligning your OEE improvement program with frameworks such as ISO 9001, IATF 16949, VDA 6.3, or FDA cGMP ensures your efforts meet both internal quality targets and external regulatory requirements.
- Cross-site comparability: For organizations with multiple facilities, standardizing OEE data collection and reporting enables VP Quality Assurance leaders and QA Directors to compare performance across sites, identify top-performing lines, and replicate successful practices enterprise-wide.
Overcoming Manufacturing Challenges with OEE
Manufacturing is not without its challenges. Every day, Plant Managers, QA Directors, and Quality Engineers face obstacles that hinder production efficiency and product quality. These issues are often compounded by paper-based audits, lack of cross-site comparability, audit fatigue, and manual corrective action processes that slow down time to resolution. Some of the most common manufacturing challenges are:
- Equipment breakdowns: Unplanned stops that occur when a machine or component fails or malfunctions due to wear and tear, improper operation, or external factors — driving up non-conformance rates and COPQ.
- Production bottlenecks: Points in the production line where the flow of work is slowed down or stopped due to insufficient capacity, resources, or coordination — reducing throughput and delaying audit completion timelines.
- Quality defects: Products that do not meet quality standards or specifications due to faulty materials, processes, or equipment. In environments regulated by FDA cGMP or IATF 16949, quality defects can trigger costly non-conformance reports and extend time to resolution for corrective actions.
These challenges can hurt your OEE score and your business performance. They can cause delays, waste, rework, customer complaints, and lost revenue. How can you overcome these challenges with OEE?
The key is to use OEE as a diagnostic tool to identify the root causes of these challenges and implement corrective actions. For Lead Auditors and QA Directors, OEE data provides the objective evidence needed to drive corrective and preventive action (CAPA) processes more efficiently. For example:
- To prevent equipment breakdowns, you can use OEE to monitor the availability and performance of your equipment and detect any signs of deterioration or malfunction. Performing predictive maintenance before the equipment fails minimizes downtime and costs — reducing COPQ and supporting ISO 9001 preventive action requirements.
- To eliminate production bottlenecks, you can use OEE to analyze the throughput and capacity of each stage of your production line and pinpoint where the bottlenecks are occurring. Optimizing workflow, balancing the load, or increasing resources eliminates bottlenecks and improves output — helping you meet audit completion rate targets and delivery commitments.
- To reduce quality defects, you can use OEE to measure the quality and consistency of your products and identify any sources of variation or error. Improving materials, processes, or equipment ensures products meet quality standards — improving FPY and reducing non-conformance rates across production lines and sites.
Leveraging Certainty Software for Manufacturing
If you are looking for a powerful tool to optimize OEE in manufacturing, look no further than Certainty Software. Certainty Software is a cloud-based solution that streamlines audit and inspection data collection, analysis, and reporting for manufacturing operations — replacing paper-based audits and manual corrective action processes with digital workflows that address the daily pain points of QA Managers, Plant Managers, and Quality Engineers.
With Certainty Software, you can:
- Easily collect quality audit and inspection data using mobile devices — eliminating paper-based processes and reducing audit fatigue for Quality Supervisors and Lead Auditors;
- Visualize and analyze your data using interactive dashboards, charts, graphs, and reports that track quality KPIs such as FPY, non-conformance rates, COPQ, and audit completion rates in real time.
- Identify trends, patterns, anomalies, and opportunities for improvement using advanced analytics and artificial intelligence — enabling faster time to resolution on corrective actions and cross-site comparability.
- Share and communicate your data and insights with your team, management, or stakeholders using secure cloud access and collaboration features — supporting compliance with ISO 9001, IATF 16949, VDA 6.3, and FDA cGMP requirements.
Certainty Software is designed to cater to the specific needs of manufacturing operations. It has a user-friendly interface and customizable features that allow QA Managers, Plant Managers, and Quality Engineers to tailor it to their industry, process, equipment, and quality goals. Whether you want to monitor a single machine or achieve cross-site comparability across a complex production network, Certainty Software helps you optimize OEE performance, improve audit completion rates, accelerate time to resolution on corrective actions, and achieve manufacturing excellence.
If you are interested in trying out Certainty Software or seeking professional consultation for implementing OEE in your manufacturing processes, please contact us today. We would love to hear from you and help you take your manufacturing efficiency to the next level.
Frequently Asked Questions (FAQs)
How does OEE relate to ISO 9001 and other quality management standards?
OEE directly supports the continuous improvement requirements found in ISO 9001, IATF 16949, and similar quality management frameworks. By systematically tracking Availability, Performance, and Quality, organizations generate the objective, data-driven evidence that auditors and Lead Auditors look for during compliance assessments. Tracking OEE over time demonstrates your organization’s commitment to reducing non-conformances and improving process capability — core expectations of these standards.
What quality KPIs should be tracked alongside OEE?
Quality Engineers and Process Improvement Leads should track OEE alongside complementary KPIs such as First Pass Yield (FPY), non-conformance rates, Cost of Poor Quality (COPQ), audit completion rates, and time to resolution for corrective actions. Together, these metrics provide a comprehensive view of both equipment effectiveness and overall quality performance. Tracking these KPIs in a unified digital platform eliminates the data silos that often result from paper-based audits and manual reporting processes.
How can OEE help reduce audit fatigue in manufacturing?
Audit fatigue is a common challenge for Quality Supervisors and Lead Auditors who manage frequent internal and external quality audits. By digitizing OEE data collection and integrating it with your quality management system, you create a single source of truth that can be referenced across multiple audits. This reduces the repetitive data gathering that contributes to audit fatigue, improves audit completion rates, and ensures that evidence for standards like VDA 6.3 and FDA cGMP is always readily available without manual preparation.
How does OEE support corrective action and root cause analysis?
OEE serves as an early warning system for quality issues by breaking down equipment losses into Availability, Performance, and Quality categories. When the Quality factor drops, it signals that defect rates are increasing — prompting Quality Supervisors and Process Improvement Leads to initiate root cause analysis and corrective action workflows. By pairing OEE data with digital corrective action management, teams can reduce time to resolution, document corrective actions for audit trails, and prevent recurrence — all of which support ISO 9001 and IATF 16949 nonconformity management requirements.
Can OEE be tracked and compared across multiple manufacturing sites?
Yes. One of the most valuable applications of OEE for VP Quality Assurance leaders and QA Directors is cross-site benchmarking. By standardizing how OEE data is collected and calculated across all facilities, organizations can compare Availability, Performance, and Quality metrics site by site — identifying top performers and sites that need improvement. Cloud-based platforms like Certainty Software make this possible by centralizing data collection and reporting, ensuring consistent measurement standards, and providing real-time dashboards that enable multi-site visibility without manual data consolidation.
You may also be interested in:

Spend Time On Prevention
Not Paperwork
Watch our overview video to see how your organization can benefit from Certainty.
Watch Video